What is a Fishbone Diagram?
What is a Fishbone Diagram?
A fishbone diagram, also called an Ishikawa diagram, is a visual method for root cause analysis that organizes cause-and-effect relationships into categories. Popularized in the 1960s, the Ishikawa diagram was used as a basic tool of quality control by Kaoru Ishikawa at the University of Tokyo. It is considered part of The Basic Seven tools of quality control today. Over time, it was nicknamed the fishbone diagram due to its resemblance to a fish skeleton laid on its side. At the mouth goes the problem itself. Each of the bones feeding into the spine of the fish represents a specific category of potential contributors to the problem.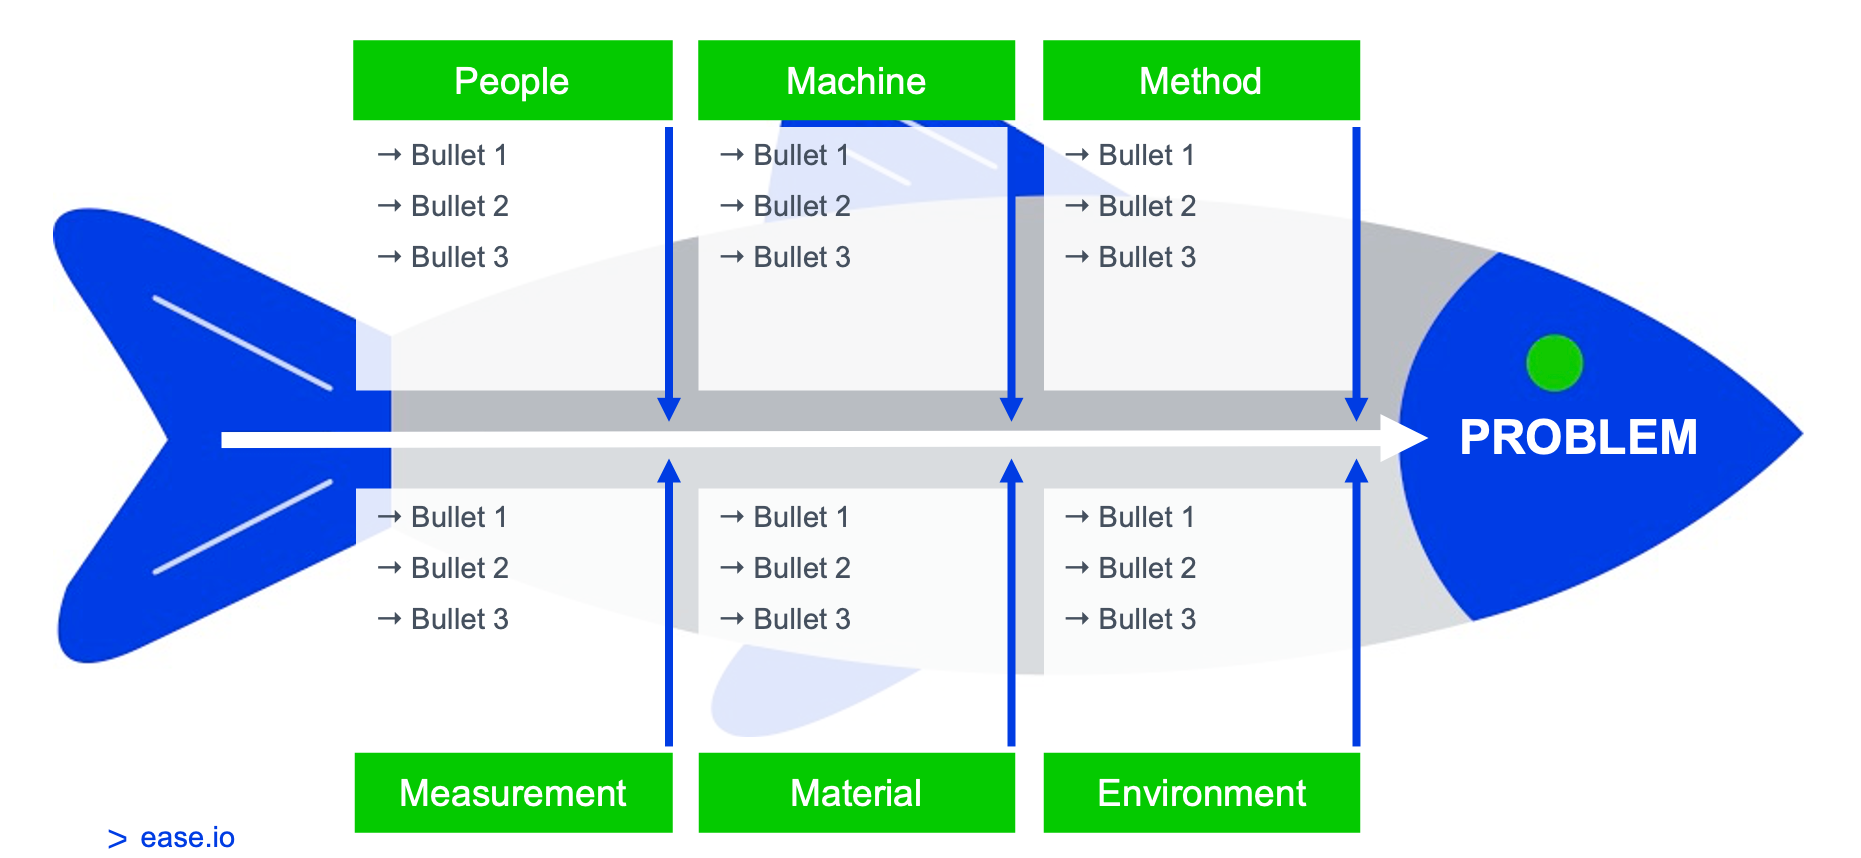 While the categories can change, the most commonly used are:
- People
- Machine
- Method
- Measurement
- Material
- Environment
People
This category is for anything related to the people associated with the process. Operators are the most common group in this category, but it can also include maintenance teams, quality control specialists and supervisors. Potential causes in this category include:- Operator did not complete training
- Employee can’t physically see defect
- Maintenance used incorrect tool
Machine
This category is for all elements related to the machines used in a process. Depending on the process, this category could capture anything from pouring robots in a foundry to printers in a book shop. Some examples of causes in this category are:- Preventative maintenance schedule not followed
- Broken or missing parts on the machine
- Machine doesn’t have correct tool head
Method
This category is for process documents and instructions. Here is where you would review any instructions used during the process being evaluated. Look at whether the instructions accurately describe the process, if they prevent a defect from occurring or even whether a picture is clear enough. Examples of causes here could be:- Instruction book not in station
- Instructions didn’t plan for this defect
- Instructions aren’t detailed enough
Measurement
This category of the fishbone diagram captures any techniques used to measure whether a part or process meets the desired quality standards. You might include information on scales, vision systems or human inspectors here, as well as sub-causes such as:- Gauge R&Rs were not completed
- Scale doesn’t function properly
- Measuring tool broke off or is missing
Material
This category captures the materials involved in a given process. Whether raw materials or inspection materials such as soapy water sprayed on a tire to detect leaks, anything added during a process can impact quality. In this area of the fishbone, you review every material that goes into a process to weigh its potential impact. Potential factors in this category include:- Base material is defective
- Part number called out does not match part number being used
- Material feature out of tolerance
Environment
This category is for relevant external factors at different points in the production process, including storage and the work area itself. For example, you might consider environmental temperature, humidity or pressure when searching for a root cause. Problems in the plant that prevent consistent environmental conditions could be the source of your troubles. Here you might find problems in areas such as:- Air conditioning vent blows on gauge, altering reading
- Hole in roof lets rainwater fall onto material racks
- Open windows allow wind to blow over tables and stands
Order Now