Types of Tools for Root Cause Analysis in Healthcare
Types of Tools for Root Cause Analysis in Healthcare
1. 5 Whys
This is a simple tool that is appropriately used to get to the root cause of a straight forward problem that does not necessitate the use of advanced statistics. (3) Simply ask the question “Why?” five times, which allows you to discover the root cause of the problem more clearly when you find that the answers to the “Why” questions are interrelated. (2) For example:-
- Why did the patient break his hip? Answer: Because he fell.
- Why did the patient fall? Answer: Because he lost his balance.
- Why did he lose his balance? Answer: Because he had nothing to hold onto.
- Why was there nothing for him to hold onto? Answer: He was unable to use his walker.
- Why was he unable to use his walker? Answer: The walker was in the closet and not readily accessible for his use.
2. Failure Mode and Effects Analysis
Use this RCA tool to identify which parts in a process are faulty so they can be corrected. It determines the number of times the failure occurs, the actions implemented by the organization to streamline the process in order to prevent the failure from recurring, and if interventions to improve the process were effective. Many organizations use this tool every time a new process is initiated. (2)3. Fault Tree Analysis
This tool involves the creation of a diagram that looks like a tree where all potential causes of the problem are depicted as branches. (2). Boolean logic, using the terms “And”, “Or”, or “Not”, are applied to each potential cause in order to identify the root cause of the problem. This tool is generally used for complex processes and by those familiar with utilizing Boolean logic. (4) (See Figure 1)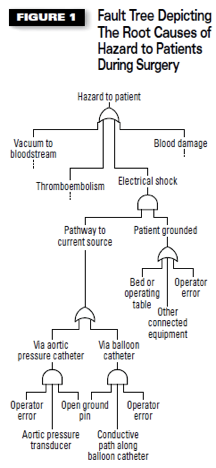 Figure 1
4. Fishbone Diagram
The shape of a fishbone is used to group potential root causes into different sub-categories such as methods, measurements, materials and many others for easier determination of the cause. This tool is relatively easy to use in determining the root cause in complex processes. (2) (See Figure 2)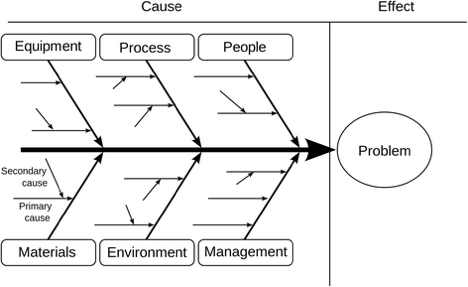 Figure 2
5. Scatter plot or scatter diagram
This a quantitative method of determining if two variables are correlated. This tool is often utilized in combination with the fishbone diagram as a means to test potential root causes. (3)6. Pareto chart
This is used to group the frequency or cost of different problems to show their relative significance. The bars show frequency or cost in descending order, while the line shows cumulative percentage or total as you move from left to right. Organizations utilize this tool when they want to show the frequency of problems that occur in process or the costs associated with the breakdown of the process. (3)7. RCA2
Root Cause Analysis Squared was developed by the National Patient Safety Foundation (2015) in an effort to ensure that appropriate and time actions are taken in response to RCA analyses to prevent future harm. The publication is frequently used by health care organizations as a guide on how to conduct efficient and effective RCAs . (5) The RCA2 process involves specific activities that start with defining which events and close calls are worthy of review and which events are blameworthy. Specific guidelines are prescribed for review team membership and timing of each activity throughout the RCA2 process. There is also embedded into the review process active participation by organizational leadership and a strong emphasis on implementation of steps to reduce the risk of a recurrence of the event.How do standardized processes and maximize Ro
Order Now